Overview
The COVID pandemic period and its associated government-imposed lockdowns and restrictions had quite a strong impact on the housing market. Evident across almost the whole of the country there was a ‘race for space’ as home movers looked for both larger properties and property with outdoor space. This mass migration of people looking for more space led to widespread house price growth, with prices rising by as much as 27% between February 2020 and November 2022 in England and Wales.
However, demand for property was not universal. As mentioned, most people seemed to be looking for properties in more rural, countryside locations and / or with outside space meaning that flats, and in particular flats in urban locations, did not see anywhere near the same levels of demand. This has meant that flat prices have hardly moved over the same period.
Explanation of area used
For the purposes of the research section of this report we have used a 10-mile radius around the centre of Newbury.
A case study: Newbury and surrounding area
For a detailed example of what has been happening in many places across the country, we are looking in more detail at Newbury and the surrounding areas. Newbury is a market town in Berkshire, England with a population of around 42,000 and is the largest settlement in the West Berkshire area. It is surrounded by some much sought after countryside locations being by the North Wessex Downs.
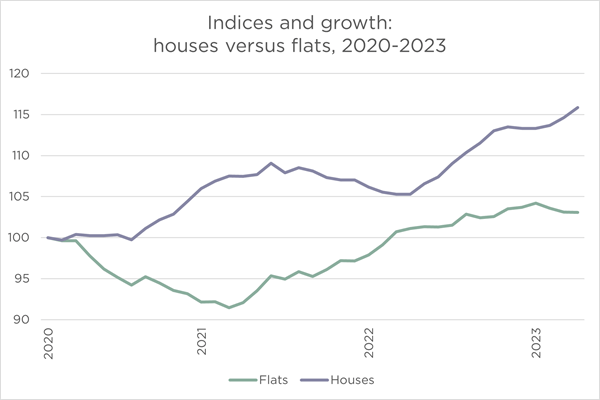
For the purposes of this study we are interested in residential property price movement over the last three years, from the start of the pandemic period to the beginning of 2023. Over that period house prices have risen by an average of 15% within a ten-mile radius of Newbury, while flat prices have risen by an average of just 3%. What’s more, in the chart below it is clearly evident just how unpopular flats were in the immediate period during the pandemic as prices for flats fell dramatically and only began recovering slowly in early 2022.

Source: REalyse using HM Land Registry
Analysing the data prior to the pandemic further reinforces that the race for space was pandemic driven. In the three-year period just prior to the pandemic between January 2017 and January 2020 house prices and flat prices showed a similar growth trajectory as each other, with both rising by an average of 4% over that timeframe.

Source: REalyse using HM Land Registry
Will this trend continue?
Much has changed since the COVID pandemic, and the financial and economic environment that we are now in is very different, it includes one of double-digit, persistent inflation, a cost-of-living crisis affecting many, and interest rates at their highest levels since 2008. As a result, buyer demand has softened and residential property prices have slowed and fallen. Having said that, Rightmove has indicated in their latest report that buyer demand in first-time buyer and second-stepper homes (traditionally at the lower and middle end of price ranges) is still between 3% and 6% higher than in the same period in 2019. Higher interest rates and evidence of higher enquiries for lower priced homes may mean that we will soon see a stronger return in demand for flats, which are typically at the lowest end of property prices.
The overall impacts of the pandemic on the housing market are now well behind us. That, together with now being in a higher interest rate environment may well mean that we see a resurgence in interest for flat properties in more urban locations, very soon.
Keep informed
Sign up to our newsletter to receive further information and news tailored to you.


